

SnowPro Advanced DSA-C03 Practice Test Engine: Try These 289 Exam Questions
Guaranteed Success in SnowPro Advanced DSA-C03 Exam Dumps
NEW QUESTION # 33
You are tasked with building a data pipeline using Snowpark Python to process customer feedback data stored in a Snowflake table called FEEDBACK DATA'. This table contains free-text feedback, and you need to clean and prepare this data for sentiment analysis. Specifically, you need to remove stop words, perform stemming, and handle missing values. Which of the following code snippets and strategies, potentially used in conjunction, provide the most effective and performant solution for this task within the Snowpark environment?
- A. Use a Python UDF that utilizes the NLTK library to remove stop words and perform stemming on the feedback text. Handle missing values by replacing them with an empty string using the .fillna(")' method on the Snowpark DataFrame after applying the UDF.
- B. Leverage Snowflake's built-in string functions within SQL to remove common stop words based on a predefined list. Use a Snowpark DataFrame to execute this SQL transformation. For stemming, research and deploy a Java UDF implementing stemming algorithms, then chain it within a Snowpark transformation pipeline. Replace missing values with the string 'N/A' during the DataFrame construction using 'na.fill('N/A')'.
- C. Utilize Snowpark's 'call_function' with a Java UDF pre-loaded into Snowflake, which removes stop words and performs stemming with libraries like Lucene. Missing values can be handled with SQL's 'NVL' function during the initial data extraction into a Snowpark DataFrame.

- D. Implement all data cleaning tasks within a single SQL stored procedure including removing stop words using REPLACE functions, stemming using a custom lookup table, and handling NULL values using COALESC Call this stored procedure from Snowpark for Python.

- E. Load the FEEDBACK DATA' table into a Pandas DataFrame using perform stop word removal and stemming using libraries like spacy or NLTK, handle missing values using Pandas' 'fillna()' method. Then, convert the cleaned Pandas DataFrame back into a Snowpark DataFrame. Use vectorization of text column in dataframe after above step
Answer: B,C
Explanation:
Options B and C provide the most effective and performant solutions.Option B leverages a combination of SQL and Java UDF to efficiently handle different parts of the cleaning process. The use of Snowflake's built-in string functions for removing stop words in SQL is efficient for common stop words, and Java UDF provides a more flexible and potentially more efficient solution for stemming. DataFrame .na.fill' is the most appropriate way to fill the missing values during the DataFrame creation. Option C: Utilizes pre-loaded Java UDFs for word processing, combined with SQL's NVL for missing value handling, is a strategy to leverage different components of Snowflake for performance and efficiency.Option A: While Python UDFs are flexible, they can be less performant than SQL or Java UDFs, especially for large datasets. Loading entire dataframe is an anti pattern. Also using .fillna on the dataframe instead of on the dataframe construction will reduce the performance. Option D: Loading all data into pandas is a bad habit and might reduce the performance. Also vectorization is not appropriate for cleaning the data. Option E: Stored procedures can be performant, relying solely on nested REPLACE functions for stop word removal can be cumbersome, and difficult to maintain compared to other approaches.
NEW QUESTION # 34
You have trained a machine learning model in Snowflake using Snowpark Python to predict customer churn. You want to deploy this model as a Snowflake User-Defined Function (UDF) for real-time scoring of new customer data arriving in a stream. The model uses several external Python libraries not available by default in the Anaconda channel. Which sequence of steps is the MOST efficient and correct way to deploy the model within Snowflake to ensure all dependencies are met?
- A. Package the model file and all dependencies into a single Python wheel file. Upload this wheel file to a Snowflake stage. Create the UDF using 'CREATE OR REPLACE FUNCTION' statement, referencing the stage and specifying the wheel file in the 'imports' parameter. Snowflake will automatically install the wheel during UDF execution.
- B. Create a Snowflake stage and upload the model file. Create a conda environment file ('environment.yml') specifying the dependencies. Upload the environment.yml file to the stage. Create the UDF using 'CREATE OR REPLACE FUNCTION' statement, referencing the stage and the environment.yml file in the 'imports' and 'packages' parameters, respectively. Snowflake will create a conda environment based on the environment.yml file during UDF execution.
- C. Create a Snowflake stage, upload the model file and a 'requirements.txt' file listing the dependencies. Create the UDF using 'CREATE OR REPLACE FUNCTION' statement, referencing the stage and specifying the 'imports' parameter with the model file and requirements.txt. Snowflake will automatically install the dependencies from the 'requirements.txt' file during UDF execution.
- D. Create a virtual environment locally with all required dependencies installed. Package the entire virtual environment into a zip file. Upload the zip file to a Snowflake stage. Create the UDF using 'CREATE OR REPLACE FUNCTION' statement, referencing the stage and specifying the zip file in the 'imports' parameter. Snowflake will automatically extract the zip and use the virtual environment during UDF execution.
- E. Create a Snowflake stage, upload the model file and all dependency .py' files. Create the UDF using 'CREATE OR REPLACE FUNCTION' statement, referencing the stage and specifying the 'imports parameter with all the file names. Snowflake will interpret all .py' files as module for UDF execution.
Answer: A
Explanation:
Packaging the model and its dependencies into a single Python wheel file is the recommended and most efficient approach. Uploading the wheel to a stage and referencing it in the 'imports' parameter allows Snowflake to handle dependency resolution seamlessly. Options A and C assume Snowflake can directly install dependencies from a requirements.txt or environment.yml file, which is not directly supported. Option D is unnecessarily complex as it involves packaging an entire virtual environment. Option E will not handle complex external packages.
NEW QUESTION # 35
You are building an image classification model within Snowflake to categorize satellite imagery based on land use types (residential, commercial, industrial, agricultural). The images are stored as binary data in a Snowflake table 'SATELLITE IMAGES. You plan to use a pre-trained convolutional neural network (CNN) from a library like TensorFlow via Snowpark Python UDFs. The model requires images to be resized and normalized before prediction. You have a Python UDF named that takes the image data and model as input and returns the predicted class. What steps are crucial to ensure optimal performance and scalability of the image classification process within Snowflake, considering the volume and velocity of incoming satellite imagery?
- A. Use a combination of Snowpark Python UDFs for preprocessing tasks like resizing and normalization, and leverage Snowflake's GPU-accelerated warehouses (if available) to expedite the inference step within the 'classify_image' UDF. Ensure the model weights are efficiently cached.
- B. Pre-process the images outside of Snowflake using a separate data pipeline and store the resized and normalized images in a new Snowflake table before running the 'classify_image' UDE
- C. Utilize Snowflake's external functions to call an image processing service hosted on AWS Lambda or Azure Functions for image resizing and normalization, then pass the processed images to the 'classify_image' UDF.
- D. Implement image resizing and normalization directly within the 'classify_image' Python UDF using libraries like OpenCV. Ensure the UDF is vectorized to process images in batches and leverage Snowpark's optimized data transfer capabilities.
- E. Load the entire 'SATELLITE IMAGES table into the UDF for processing, allowing the UDF to handle all image resizing, normalization, and classification tasks sequentially.
Answer: A,D
Explanation:
Options B and E represent the most effective strategies. Option B emphasizes in-database processing with a vectorized 'DF and optimized data transfer. Option E highlights the use of 'DFs for preprocessing and leverages GPU acceleration for the computationally intensive inference step, along with efficient model weight caching. Option A introduces unnecessary complexity with external functions, which can add latency. Option C requires additional data storage and management outside of the core classification process. Option D is inefficient because loading the entire table into the 'DF is not scalable and will likely cause performance issues. Vectorizing the 'DF allows for batch processing, which significantly improves throughput. GPU acceleration further enhances the speed of model inference, and caching the model prevents repeated loading, saving computational resources.
NEW QUESTION # 36
A data scientist is exploring customer purchase data in Snowflake to identify high-value customer segments. They have a table named 'CUSTOMER TRANSACTIONS with columns 'CUSTOMER ID', 'TRANSACTION_DATE', and 'PURCHASE_AMOUNT'. They want to calculate the interquartile range (IQR) of 'PURCHASE AMOUNT for each customer. Which SQL query using Snowsight is the most efficient and accurate way to calculate and display the IQR for each 'CUSTOMER ID?
- A. Option E
- B. Option A
- C. Option B
- D. Option D
- E. Option C
Answer: A
Explanation:
Option E, using 'QUANTILE, is the most accurate way to calculate the IQR. 4)' returns an array representing the quartiles (0%, 25%, 50%, 75%, 100%). Subtracting the 25th percentile (index 1) from the 75th percentile (index 3) gives the IQR. Other options either approximate the percentiles (APPROX_PERCENTILE), calculate the range (MAX-MIN), or calculate standard deviation, none of which directly give the IQR. Option B while syntactically valid is less performant and returns the IQR on entire table not grouped by customer.
NEW QUESTION # 37
You've trained a machine learning model using Scikit-learn and saved it as 'model.joblib'. You need to deploy this model to Snowflake. Which sequence of commands will correctly stage the model and create a Snowflake external function to use it for inference, assuming you already have a Snowflake stage named 'model_stage'?
- A. Option E
- B. Option A
- C. Option B
- D. Option D
- E. Option C
Answer: A
Explanation:
NEW QUESTION # 38
You are working with a large dataset of customer transactions in Snowflake. The dataset contains columns like 'customer id' , 'transaction date', 'product category' , and 'transaction_amount'. Your task is to identify fraudulent transactions by detecting anomalies in spending patterns. You decide to use Snowpark for Python to perform time-series aggregation and feature engineering. Given the following Snowpark DataFrame 'transactions_df , which of the following approaches would be MOST efficient for calculating a 7-day rolling average of for each customer, while also handling potential gaps in transaction dates?
- A. Use a Snowpark Pandas UDF to calculate the rolling average for each customer after collecting all transactions for that customer into a Pandas DataFrame. Handle missing dates using Pandas functionality.
- B. Use a stored procedure in SQL to iterate over each customer, calculate the rolling average using a cursor and conditional logic for handling missing dates.
- C. Use 'window.partitionBy('customer_id').orderBy('transaction_date').rowsBetween(-6, Window.currentRow)' within a 'select' statement and handle any missing dates using 'fillna()' after calculating the rolling average.
- D. Use a simple followed by a UDF to calculate the rolling average. Fill in missing dates manually within the UDF.
- E. Use'window.partitionBy('customer_id').orderBy('transaction_date').rangeBetween(Window.unboundedPreceding, Window.currentRow)' in conjunction with a date range table joined to the transactions, filling in missing days before calculating the rolling average with 'transaction_amount' set to 0 for the inserted days.
Answer: E
Explanation:
Option E is the MOST efficient. Using a date range table joined with the transactions DataFrame to fill in missing dates before calculating the rolling average using 'rangeBetween' is more performant than options that involve UDFs or procedural logic. Options A, C, and D introduce overhead with UDFs or stored procedures which can be slow for large datasets. Option B is less flexible in handling missing dates because 'rowsBetween' considers only the row number, not the actual date difference, potentially leading to inaccurate averages when there are gaps in dates.
NEW QUESTION # 39
You're working with a large dataset of user transactions in Snowflake. You need to identify potential outliers in transaction amounts C TRANSACTION AMOUNT) for each user CUSER ID'). Your goal is to flag transactions that are more than 3 standard deviations away from the mean transaction amount for that specific user. Which of the following approaches, utilizing Snowflake's statistical functions and window functions, would be MOST efficient and accurate for achieving this?
- A. Exporting the data to a Python environment, performing the calculations using Pandas, and then re-importing the results to Snowflake.
- B. Creating a stored procedure that iterates through each user and calculates the mean and standard deviation individually.
- C. Calculating the overall mean and standard deviation for all transactions and filtering transactions based on those global statistics.
- D. Using a correlated subquery to calculate the mean and standard deviation for each user and then filtering the transactions.
- E. Using window functions to calculate the mean and standard deviation for each user within the same query, and then comparing each transaction amount to the calculated range.
Answer: E
Explanation:
Using window functions (option C) is the most efficient and accurate approach. It allows you to calculate the mean and standard deviation for each user within the same query, avoiding the overhead of correlated subqueries (option A) or the inaccuracy of global statistics (option B). Options D and E are less efficient due to data transfer and procedural logic overhead. Correlated subquery will lead to performance issue and is not advisable for bigger datasets.
NEW QUESTION # 40
You are tasked with performing data profiling on a large customer dataset in Snowflake to identify potential issues with data quality and discover initial patterns. The dataset contains personally identifiable information (PII). Which of the following Snowpark and SQL techniques would be most appropriate to perform this task while minimizing the risk of exposing sensitive data during the exploratory data analysis phase?
- A. Create a masked view of the customer data using Snowflake's dynamic data masking features. This view masks sensitive PII columns while allowing you to compute aggregate statistics and identify patterns using SQL and Snowpark functions. Columns like 'email' are masked using and columns like are masked using .
- B. Export the entire customer dataset to an external data lake for exploratory analysis using Spark and Python. Apply data masking in Spark before analysis.
- C. Directly query the raw customer data using SQL and Snowpark, computing descriptive statistics like mean, median, and standard deviation for all numeric columns and frequency counts for categorical columns. Store the results in a temporary table for further analysis.
- D. Apply differential privacy techniques using Snowpark to add noise to the summary statistics generated from the customer data, masking the individual contributions of each customer while revealing overall trends.
- E. Utilize Snowpark to create a sampled dataset (e.g., 1% of the original data) and perform all exploratory data analysis on the sample to reduce the data volume and potential exposure of PII.
Answer: A,D
Explanation:
Options C and D provide the most secure and effective ways to perform exploratory data analysis while protecting PII. Differential privacy (C) ensures that aggregate statistics do not reveal too much information about individuals. Masked views (D) prevent direct access to sensitive data, replacing it with masked values during the analysis. A is dangerous because it exposes the raw data. B while reduces the volume, still exposes raw data. E is risky because it involves exporting sensitive data outside of Snowflake.
NEW QUESTION # 41
You've deployed a fraud detection model in Snowflake using Snowpark. You are monitoring its performance and notice a significant decrease in recall, while precision remains high. This means the model is missing many fraudulent transactions. The training data was initially balanced, but you suspect that recent changes in user behavior have skewed the distribution of fraudulent vs. non-fraudulent transactions in production. Which of the following actions are MOST appropriate to address this issue and improve the model's performance, considering best practices for model retraining within the Snowflake ecosystem?
- A. Retrain the model using the original training data. Since the precision is high, the model's fundamental logic is still sound. A larger training dataset isn't necessary.
- B. Adjust the model's classification threshold to be more sensitive, even if it means accepting a slightly lower precision. This can be done directly within Snowflake using a SQL UDF that transforms the model's output probabilities.
- C. Implement a data drift monitoring system in Snowflake to automatically detect changes in the input features of the model. Trigger an automated retraining pipeline when significant drift is detected. This retraining should include recent production data with updated labels, but only if label data collection can be automated.
- D. Retrain the model using a dataset that includes recent production data, being sure to re-balance the dataset to maintain a roughly equal number of fraudulent and non-fraudulent transactions. Prioritize transactions from the last month.
- E. Immediately shut down the model to prevent further inaccurate classifications. Investigate why the recall is low before any retraining is performed.
Answer: B,C,D
Explanation:
Options B, C, and D are the most appropriate. B addresses the data drift by incorporating recent production data with re-balancing to mitigate the skewed distribution. C directly improves recall by adjusting the classification threshold. D establishes a proactive drift detection and retraining system which is a best practice for long-term model maintenance. A is incorrect because the original data doesn't reflect current trends. E is too drastic initially; adjusting the threshold and retraining are preferred first. Retraining with balanced, recent data is critical, especially if the class distribution has shifted. Monitoring for drift provides an automated approach to maintaining model accuracy in a changing environment. Also a low code retraining pipeline is appropriate considering current model performance with SQL udf transformations.
NEW QUESTION # 42
You are tasked with training a logistic regression model in Snowflake using Snowpark Python to predict customer churn. Your data is stored in a table named 'CUSTOMER DATA' with columns like 'CUSTOMER D', 'FEATURE 1', 'FEATURE 2', 'FEATURE 3', and 'CHURN FLAG' (boolean representing churn). You plan to use stratified k-fold cross-validation to ensure each fold has a representative proportion of churned and non-churned customers. Which of the following code snippets demonstrates the correct way to perform stratified k-fold cross-validation with Snowpark ML? (Assume 'snowpark_session' is a valid Snowpark session object).
- A.

- B.

- C.

- D.

- E.

Answer: A
Explanation:
Option E is the only correct code snippet. Here's why: StratifiedKFold: It uses 'StratifiedKFold' from , which is necessary for ensuring that each fold has a similar class distribution. Pandas Conversion: The stratified k-fold split function requires Pandas dataframes as input, so tables 'CUSTOMER_DATA' is converted to Pandas DataFrame. Correct Data Preparation: The code splits features and labels correctly and passes them to StratifiedKFold'. The train and test indices derived from skf.split can be used to slice pandas dataframe and assign it to the correct variables. The ravel() converts the y into a ID array which is what is expected by the split method Snowflake ML Model Training: The 'LogisticRegression' model is fit and scored within the loop using the correct data. Other options are incorrect because: A: Uses KFold instead of StratifiedKFold, so does not stratify. Does not properly handle indices derived from the folds. B: Uses StratifiedKFold but does not properly handle indices derived from the folds, and doesn't use Pandas. C: Uses Pandas but doesn't pass proper input features, meaning split won't work. Also, handles indices improperly D: Improperly uses functions from Snowpark and doesn't use Pandas. Also, handles indices improperly.
NEW QUESTION # 43
You are analyzing website traffic data stored in a Snowflake table named 'WEB EVENTS. This table contains a 'TIMESTAMP' column representing when the event occurred and a 'PAGE VIEWS column indicating the number of page views for that event. You need to identify the day with the highest number of page views and also the day with lowest number of page views along with average number of page views. How can you accomplish this using Snowflake SQL?
- A. Option E
- B. Option A
- C. Option B
- D. Option D
- E. Option C
Answer: D
Explanation:
Option D provides the correct answer. The first two queries correctly identify the day with the highest and lowest total views, respectively, using 'DATE(TIMESTAMP)' to extract the date, to aggregate page views, 'GROUP BY' to group by date, "ORDER BY' to sort, and 'LIMIT 1' to select only the top/bottom day. It also has the correct query to identify average page views 'SELECT OVER() FROM WEB_EVENTS LIMIT Other Options A and E are quite close but they don't identify the same, in option A, 'SELECT AVG(PAGE_VIEWS) FROM WEB_EVENTS' , the AVG page views won't tell us the dates of min max and Avg views. Similar is the problem with option E, 'SELECT FROM WEB_EVENTS The APPROX_AVG won't tell us which day has highest or lowest.
NEW QUESTION # 44
You are working with a large dataset of sensor readings stored in a Snowflake table. You need to perform several complex feature engineering steps, including calculating rolling statistics (e.g., moving average) over a time window for each sensor. You want to use Snowpark Pandas for this task. However, the dataset is too large to fit into the memory of a single Snowpark Pandas worker. How can you efficiently perform the rolling statistics calculation without exceeding memory limits? Select all options that apply.
- A. Break the Snowpark DataFrame into smaller chunks using 'sample' and 'unionAll', process each chunk with Snowpark Pandas, and then combine the results.
- B. Increase the memory allocation for the Snowpark Pandas worker nodes to accommodate the entire dataset.
- C. Use the 'grouped' method in Snowpark DataFrame to group the data by sensor ID, then download each group as a Pandas DataFrame to the client and perform the rolling statistics calculation locally. Then upload back to Snowflake.
- D. Utilize the 'window' function in Snowpark SQL to define a window specification for each sensor and calculate the rolling statistics using SQL aggregate functions within Snowflake. Leverage Snowpark to consume the results of the SQL transformation.
- E. Explore using Snowpark's Pandas user-defined functions (UDFs) with vectorization to apply custom rolling statistics logic directly within Snowflake. UDFs allow you to use Pandas within Snowflake without needing to bring the entire dataset client-side.
Answer: D,E
Explanation:
Explanation:Options B and D are the most appropriate and efficient solutions for handling large datasets when calculating rolling statistics with Snowpark Pandas. Option B uses the 'window' function in Snowpark SQL. Leverage the 'window' function in Snowpark SQL to define a window specification for each sensor and calculate the rolling statistics using SQL aggregate functions within Snowflake. Option D uses Snowpark's Pandas UDFs. Snowpark's Pandas UDFs with vectorization allow you to bring the processing logic to the data within Snowflake, avoiding the need to move the entire dataset to the client-side and bypassing memory limitations. This approach is generally more scalable and performant for large datasets. Option A is inefficient as it retrieves groups of data from Snowflake to client side before creating the calculations before sending back to snowflake. Option C is correct but complex and not optimal. Option E is possible, but it's not a scalable solution and can be costly.
NEW QUESTION # 45
You are building a model to predict loan defaults using data stored in Snowflake. As part of your feature engineering process within a Snowflake Notebook, you need to handle missing values in several columns: 'annual _ income', and You want to use a combination of imputation strategies: replace missing values with the median, 'annual_income' with the mean, and with a constant value of 0.5. You are leveraging the Snowpark DataFrame API. Which of the following code snippets correctly implements this imputation strategy?
- A. Option E
- B. Option A
- C. Option B
- D. Option D
- E. Option C
Answer: B,D
Explanation:
Options A and D both correctly implement the specified imputation strategy. Option A uses 'fillna' method with respective median and mean values, calculated using 'approxQuantile' and mean for missing values.Option B uses 'na.fill' which is used in Spark, and Snowflake is not compatible. Option C calculates the median and mean, but incorrectly tries to use the local Python variables inside F.lit() functions, which are executed on the Snowflake server. Option D uses loops for column selection. Option E tries to apply a literal value within a dictionary being used to fill the missing values. This is not correct, and it's important to ensure that a correct implementation is used.
NEW QUESTION # 46
You have deployed a fraud detection model in Snowflake, predicting fraudulent transactions. Initial evaluations showed high accuracy. However, after a few months, the model's performance degrades significantly. You suspect data drift and concept drift. Which of the following actions should you take FIRST to identify and address the root cause?
- A. Implement a SHAP (SHapley Additive exPlanations) analysis on recent transactions to understand feature importance shifts and potential concept drift.
- B. Increase the model's prediction threshold to reduce false positives, even if it means potentially missing more fraudulent transactions.
- C. Immediately retrain the model with the latest available data, assuming data drift is the primary issue.
- D. Revert to a previous version of the model known to have performed well, while investigating the issue in the background.
- E. Implement a data quality monitoring system to detect anomalies in input features, alongside calculating population stability index (PSI) to quantify data drift.
Answer: E
Explanation:
Option D is the best first step. Data quality monitoring and PSI allow for quantifying and identifying data drift. SHAP (B) is useful after determining that concept drift is the problem. Retraining immediately (A) without understanding the cause can exacerbate the problem. Reverting (C) is a temporary fix, not a solution. Adjusting the threshold (E) without understanding the underlying issue is also not a proper diagnostic approach.
NEW QUESTION # 47
A data scientist is developing a fraud detection model using Snowpark ML on Snowflake. They have a feature engineering pipeline implemented as a Snowpark DataFrame transformation. The pipeline includes several complex UDFs. The data scientist observes that the pipeline execution is slow. What are the most effective techniques to optimize the feature engineering pipeline's performance in Snowpark?
- A. Reduce the size of the input DataFrame by sampling the data.
- B. Disable Snowpark's lazy evaluation by executing on the DataFrame after each transformation.
- C. Replace Python UDFs with Snowflake SQL UDFs where possible, as SQL UDFs often offer better performance due to Snowflake's optimization capabilities.
- D. Rewrite Python UDFs as vectorized Python UDFs using the 'pandas' API within Snowpark to leverage batch processing.
- E. Cache intermediate DataFrames using or 'persist()' to avoid recomputation of common transformations.
Answer: C,D,E
Explanation:
Caching intermediate results (B) prevents redundant calculations. Vectorized Python UDFs (C) using pandas enhance performance by processing data in batches. Snowflake SQL UDFs (E) can often outperform Python UDFs due to Snowflake's internal optimizations. Sampling (A) might reduce accuracy. Disabling lazy evaluation (D) negates the benefits of Snowpark's query optimization.
NEW QUESTION # 48
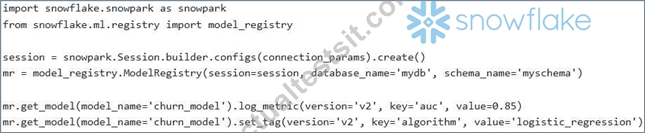
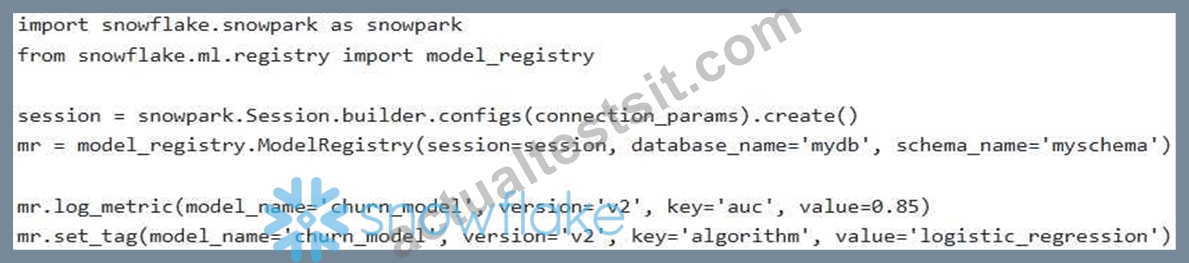
You are developing a churn prediction model and want to track its performance across different model versions using the Snowflake Model Registry. After registering a new model version, you need to log evaluation metrics (e.g., AUC, F 1-score) and custom tags associated with the training run. Assuming you have a registered model named 'churn_model' with version 'v2', which of the following code snippets demonstrates the correct way to log these metrics and tags using the Snowflake Python Connector and the 'ModelRegistry' API?
- A.

- B.
- C.

- D.
- E.

Answer: A
Explanation:
Option A is correct. It first retrieves the specific model version using , and then calls and 'set_tag' on the returned 'version' object. The other options either attempt to call these methods directly on the "ModelRegistry' object (incorrect as these are version-specific operations) or use incorrect syntax for accessing versions.
NEW QUESTION # 49
A marketing team uses Snowflake to store customer purchase data'. They want to segment customers based on their spending habits using a derived feature called The 'PURCHASES' table has columns 'customer id' (IN T), 'purchase_date' (DATE), and 'purchase_amount' (NUMBER). The team needs a way to handle situations where a customer might have missing months (no purchases in a particular month). They want to impute a 0 spend for those months before calculating the average. Which approach provides the most accurate and robust calculation, especially when considering users with sparse purchase history?
- A. Calculate the average monthly spend directly from the 'PURCHASES' table without accounting for missing months: 'AVG(purchase_amount) GROUP BY customer_id, date_trunc('month',
- B. Create a view containing all months for each customer, left join with the 'PURCHASES' table, impute 0 for null 'purchase_amounts values, and then calculate the average spend. Requires creating a helper table for all the month.
- C. Use a window function to calculate the average spend over a fixed window of the last 3 months, ignoring missing months in the calculation.
- D. Calculate the average spend only for customers with purchases in every month of the year. Ignore other customers in the analysis.
- E. Calculate the total spend for each customer and divide by the number of months since their first purchase: / DATEDlFF(month, CURRENT DATE()) GROUP BY customer_id'.
Answer: B
Explanation:
Option B provides the most accurate and robust solution. By creating a view with all months for each customer and joining with the "PURCHASES' table, you can explicitly account for missing months by imputing 0 spend. This ensures that the average spend calculation is not biased by only considering months with purchases. Option A will underestimate the average spend for customers with missing months. Option C focuses only on recent months and doesn't address the issue of imputing 0 for missing data, potentially creating bias. Option D divides by the total number of months since the first purchase, but doesn't explicitly account for missing months with 0 spend. Option E biases your data by only looking at full year users.
NEW QUESTION # 50
......
Test Engine to Practice DSA-C03 Test Questions: https://protechtraining.actualtestsit.com/Snowflake/DSA-C03-exam-prep-dumps.html